


 Copy to clipboard
Orthopedic device research and development (R&D) is an expensive proposition. It’s also a risky process that fails more often than not.
The cost to bring a medical device through the FDA 510(k) approval process is millions of dollars. Companies spend between 5% and 20% of their revenue on R&D, which does not count the money spent by larger companies to acquire smaller companies and their products. A 2020 research review found that 88% of corporations that develop medical device technologies do not provide considerable returns for their investors.
Advantages gained by better management of the R&D process can result in massive savings for a company and, in many cases, can be the difference between the success and complete failure of a startup.
Let’s explore a fundamental problem facing traditional project management for medical device R&D, the operations science governing all orthopedic R&D projects and a few practical methods for avoiding the pitfalls that doom many project management efforts.
Fundamental Flaws
While there are many ways to describe the new product development process, we will use the following definition for the purposes of this discussion. Not all steps are required for all regulatory path options. For example, clinical trials are not likely for 510(k) regulatory approval but are a prerequisite for PMA approval.
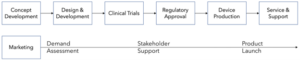
There are also many stakeholders involved in developing new orthopedic devices. A non-comprehensive stakeholder list (in the United States) includes:
- Patients
- FDA
- CMS
- Hospitals
- Physicians
- Contract manufacturers
- Professional societies
- Investors
- Medical device company employees and management
The typical project management approach used to manage this complexity involves Gantt Chart plans such as the one shown below.

The tasks (listed in rows down the left side) are assigned durations (shown by the bars on the right side). The exercise of listing tasks and their dependencies is highly beneficial and a basic requirement for successful management of any new product introduction.
Using the Gantt Chart plan to predict outcomes or the expected cost of a project is highly unreliable. Yet, many companies proceed with similar plans and are surprised when results don’t meet expectations. Such a plan is precisely wrong every time it is published due to variability. The practice of updating a complex plan very frequently to maintain accuracy, besides being impractical, simply results in being precisely wrong more frequently. This is true for R&D as well as for other segments of the orthopedic device development process.
A prerequisite for sustainable, predictable control over R&D projects is understanding and applying operations science, which describes the behavior and relationships governing how activities and resources (people and equipment) interact. It helps to ensure all R&D projects are predictably completed on time and within budget.
This has been demonstrated repeatedly on some of the largest R&D projects in the world. See Operations Science for Project Management for further detail. Being lucky is not a long-term strategy. R&D project success is largely a matter of chance without understanding operations science.
Managing Variability
Operations science is the study of the transformation of resources to provide goods and services. It focuses on the interaction between demand and transformation, and the variability associated with either or both. The concept also describes the set of buffers — inventory, capacity and time — required to synchronize demand with transformation.
A common problem for most project management efforts is that project managers don’t see the science governing it. They confuse project controls such as a plan (like a Gantt Chart), the accompanying schedule and costs as project control (note the lack of an “s”). Project controls are not the same as having control of the project.
In a perfect world, a project deliverable, such as a design simulation or a paperwork submission, would be completed exactly when it was needed (demanded). There would be no errors, and the minimum number of resources (people) would be used to create the deliverable. Transformation would be exactly equal to demand. There would be minimum cost and minimum time required to complete a project on time.
The problem is that no one works in a perfect world due to variability — people miss work, simulations don’t work right the first time and paperwork errors occur. In the presence of variability, buffers are required to synchronize demand and transformation. Only three buffers exist: capacity, inventory and time.
Further, specific relationships exist between the buffers and variability that are not well understood by project managers. Three primary relationships are illustrated by the curves below:
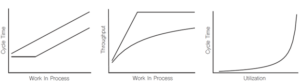
These relationships describe the behavior of all projects. Project managers who ignore them do so at their, and their project’s, peril.
Real-world Applications
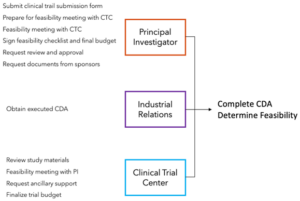
We switch from conceptual description to an illustration of the concepts in action using the clinical trial process map from Loma Linda University shown below.
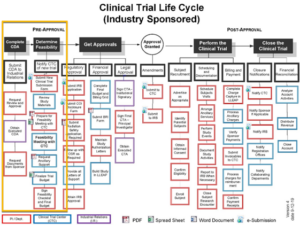
For simplicity, we will focus only on the pre-approval process (tasks in the yellow box).
Note that from the map’s color coding there are only three resources involved:
- Principal Investigator Department (red)
- Clinical Trial Center (blue)
- Industrial Relations Department (purple)
Granted, there are many people working in each area, but we’ll assume for a simple illustration that each resource is just one person. We’ll also make a translation to a project production map as shown below.
Here we see our resources and the tasks that each stakeholder must complete to meet demand. The demand here is for a completed Confidentially Disclosure Agreement (CDA) and feasibility determination. Demand is defined as a rate, which might be four completed CDAs and four feasibility determinations per month.
To further the example, assume the following:
- Demand is five CDAs and five feasibility determinations per week
- Time available for each resource is 30 hours per week
- Time required to complete each task is one hour
So, each week the required time for each resource to produce five CDAs and five feasibility
determinations is as follows:
- Principal Investigator
(1 hour/task)(6 tasks)(5) = 30 hours
- Industrial Relations
(1 hour/task)(1 task)(5) = 5 hours
- Clinical Trial Center
(1 hour/task)(4 tasks)(5) = 20 hours
In this simple example, the utilization of each resource is as follows:
- Principal Investigator = 30/30 = 100%
- Industrial Relations = 5/30 = 17%
- Clinical Trial Center = 20/30 = 67%
Now we have information that could not be determined from the Gantt Chart or the process map. Further, we know that the entire process is constrained by the Principal Investigator and, based on operations science, any planning based on 100% utilization of a resource is going to be highly unreliable (see rightmost curve above that shows cycle time vs. utilization).
The examples above show important concepts for understanding and controlling any R&D project.
First, know your Work In Process (WIP) and set optimal levels to achieve minimum cycle time with maximum throughput (as shown in the left and middle curves above). WIP does not have to be a physical object; it only must require time on a resource. So all the tasks that people have to do in an R&D process represent WIP.
Second, know your resource utilization. In R&D projects, the primary resource for completing tasks is usually people. Scheduling teams to work at 100% utilization is a recipe for failure.
There are many other insights to be gained from applying operations science to orthopedic device R&D projects. However, the main point is that there is a science that governs the behavior of projects. One wouldn’t develop orthopedic devices without good orthopedic science and one shouldn’t manage R&D projects without good operations science.
Edward S. Pound, an OMTEC® 2018 speaker, is Managing Director at the Operations Science Institute and lead author of McGraw-Hill’s lead business title, Factory Physics for Managers. He has more than 30 years of management and consulting experience in medical devices, aerospace, electronics, pharmaceuticals, cloud infrastructure development, consumer retail, healthcare, energy and public infrastructure construction, and engineer-to-order capital equipment. Mr. Pound has helped pioneer the advanced benefits that operations science brings to business. He holds a B.S. and a M.S. in mechanical engineering, an M.E.M and an M.B.A. He is also a Past President of the Industrial and Systems Engineering Society’s Work Systems division.